
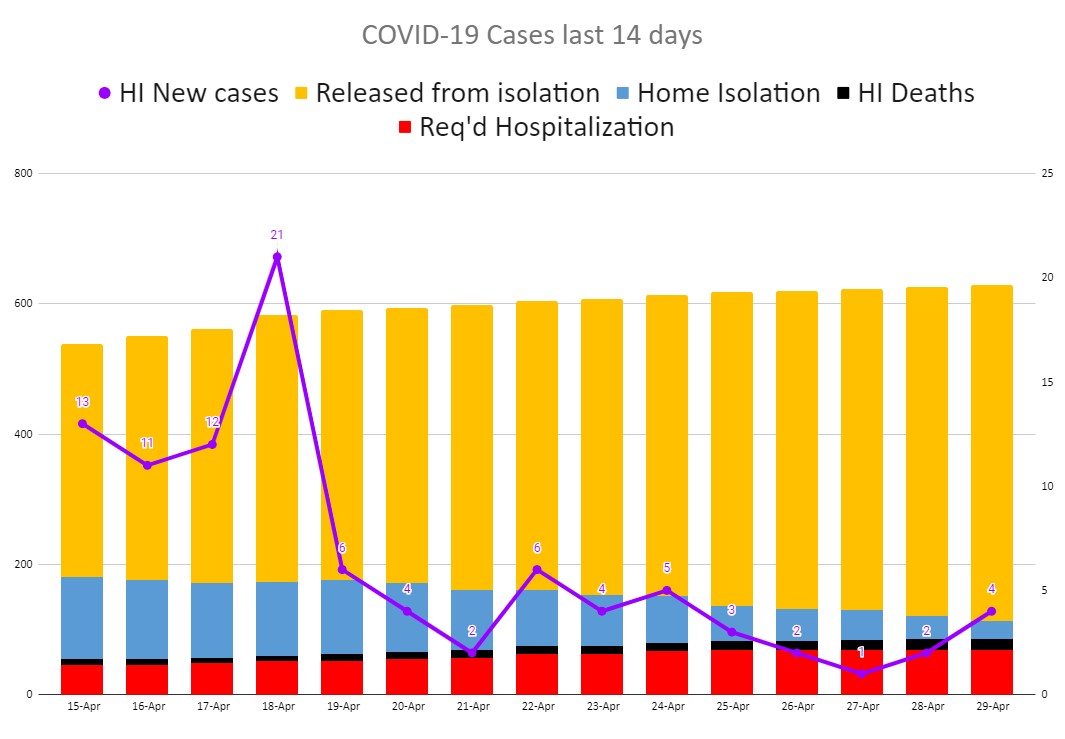


Look at the yellow bars chart – we only have a handful of people still in isolation.
Dept of Health is not supply numbers on those released from hospitalization so it is a cumulative number.
With only a handful of new cases each day, we’ll soon be in a strange mathematical place where new case trend lines will be meaningless – essentially flat.
All suggestions and commentary is welcome!
| Total Cases: | 613 |
| Current Growth Rate: | 0.7% |
| 3 Day Average Growth Rate: | 0.4% |
| Current Home Isolation: | 28 |
| Current Hospitalization: | 69 |
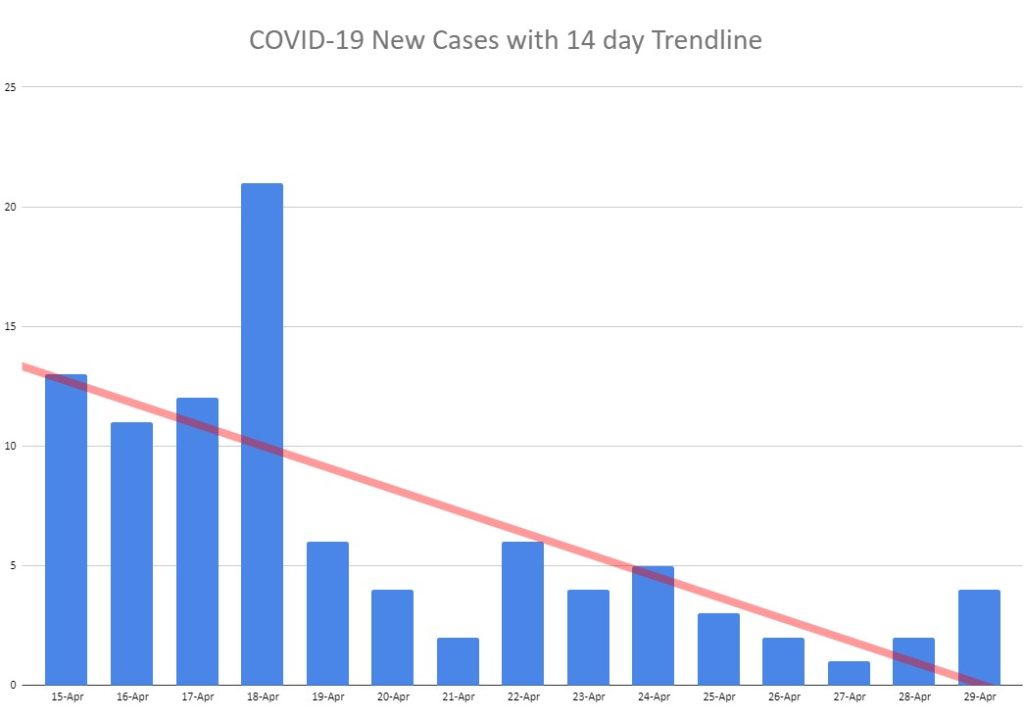
Bar chart of new cases each day with trendline 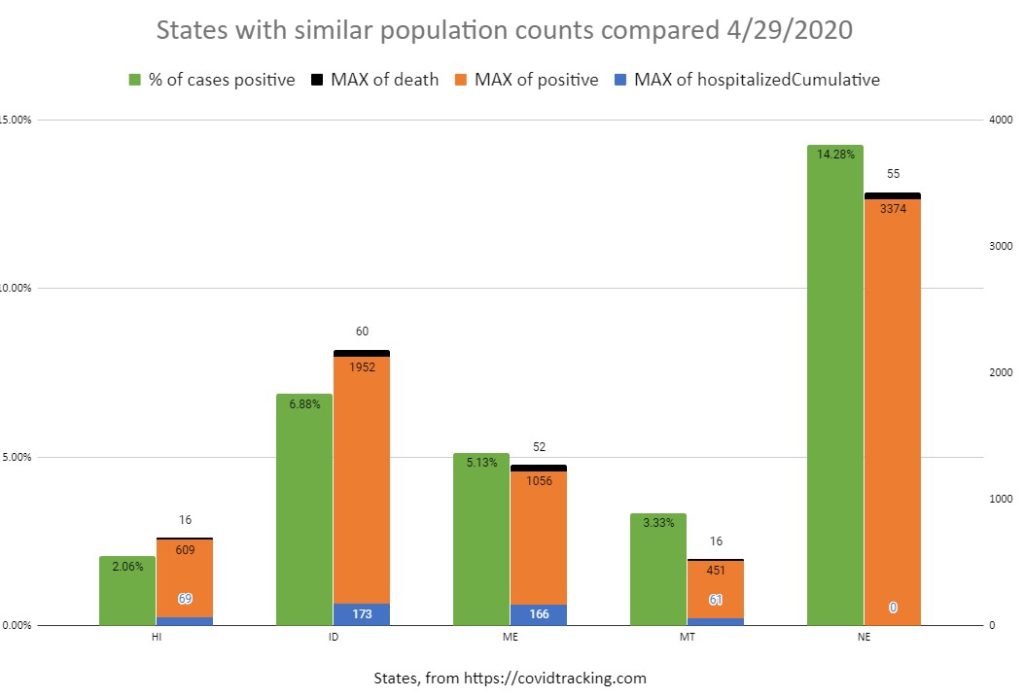
Bar chart showing how Hawaii compares to other states of similar population 
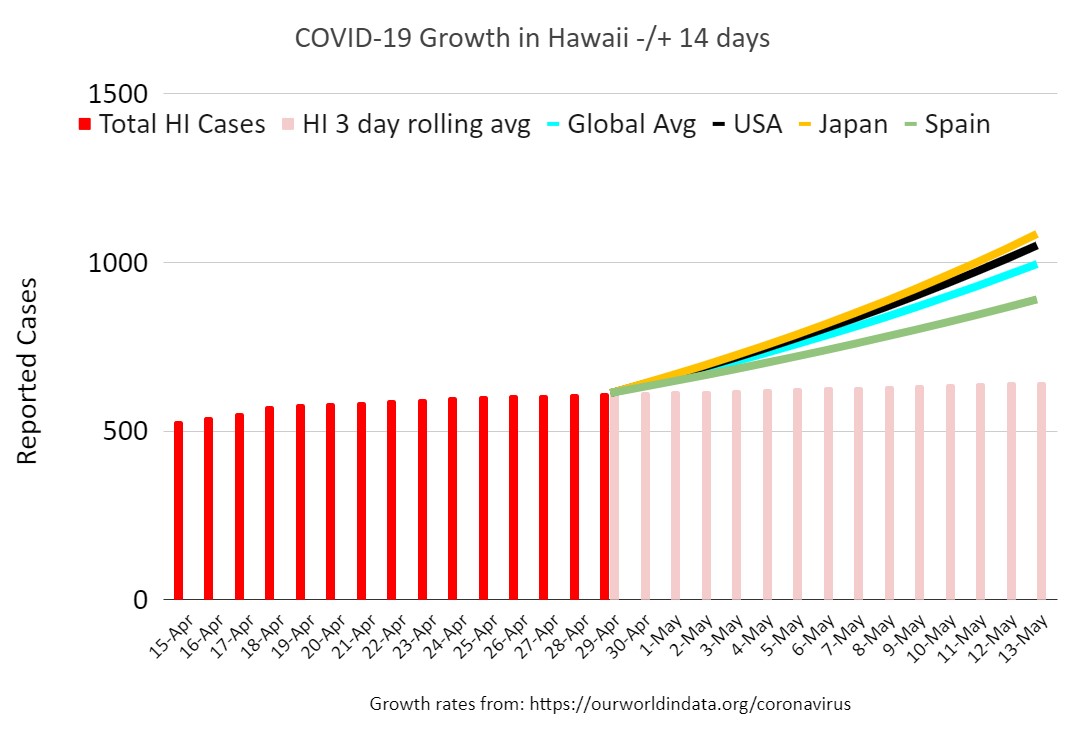
Bar chart of current and forecast covid19 growth comparing Hawaii with benchmark global sources 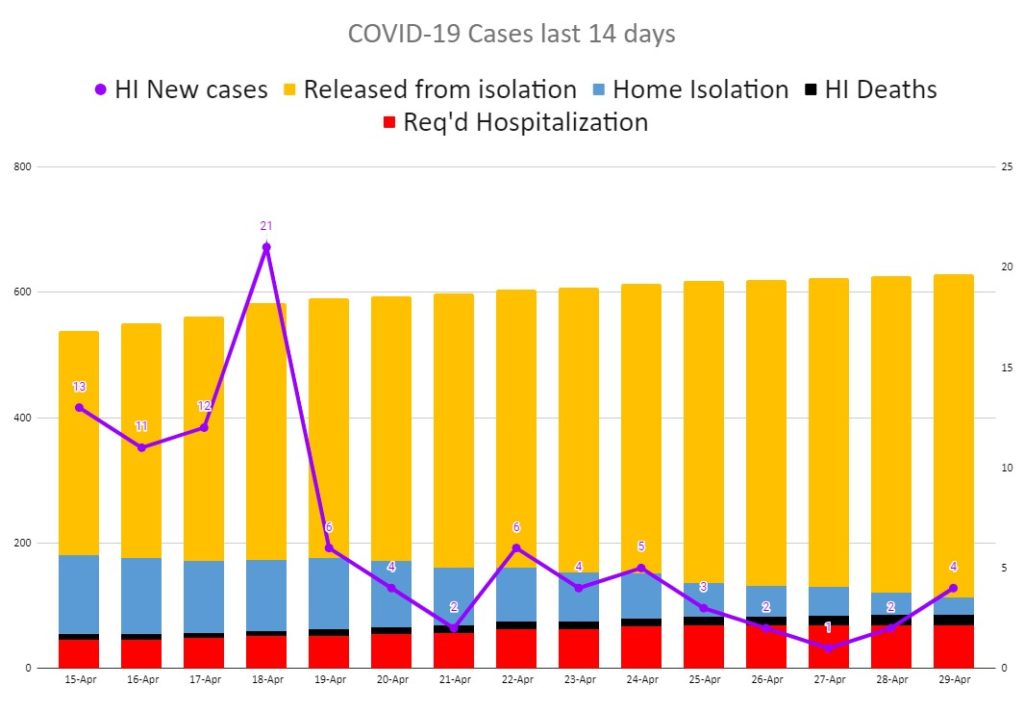
Bar chart of current and forecast covid19 growth comparing Hawaii with benchmark global sources

What do you think?