
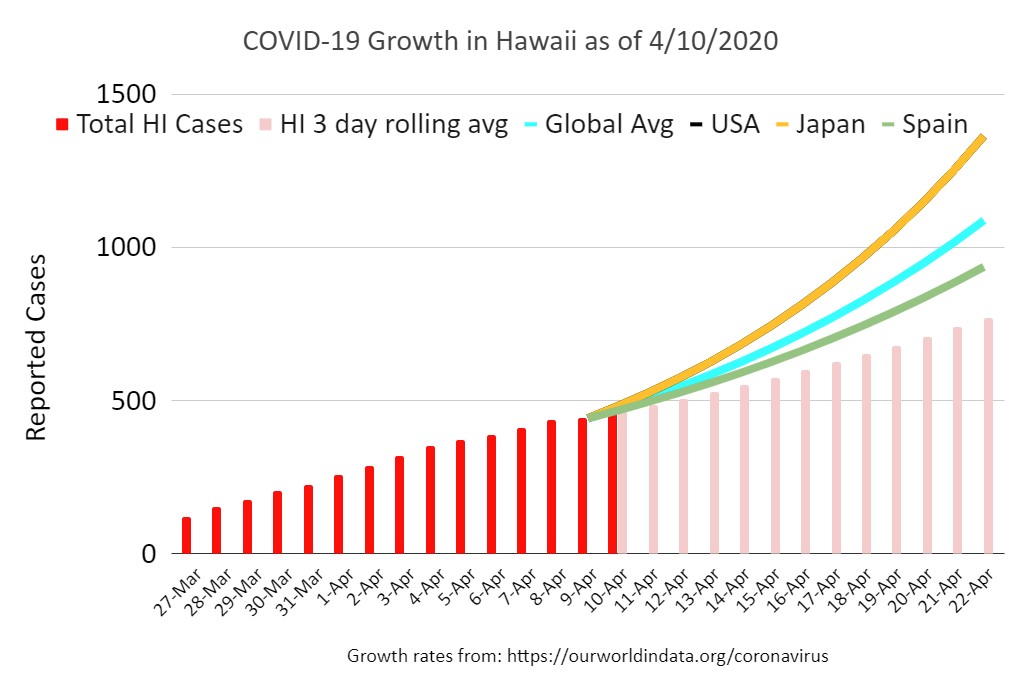
23 new cases today is keeping our growth rate at a world-beating 4.3% 3 day average.
Hospitalization flat so far and we sadly had a +2 deaths. I combined 2 graphs to one so that we can see the makeup of the total cases in one chart vs. growth estimates in the other. LMK what you think.
Have a great weekend!
All suggestions and commentary is welcome!
| Total Cases: | 465 |
| Current Growth Rate: | 5.2% |
| 3 Day Average Growth Rate: | 4.3% |
| Current Home Isolation: | 139 |
| Current Hospitalization: | 42 |
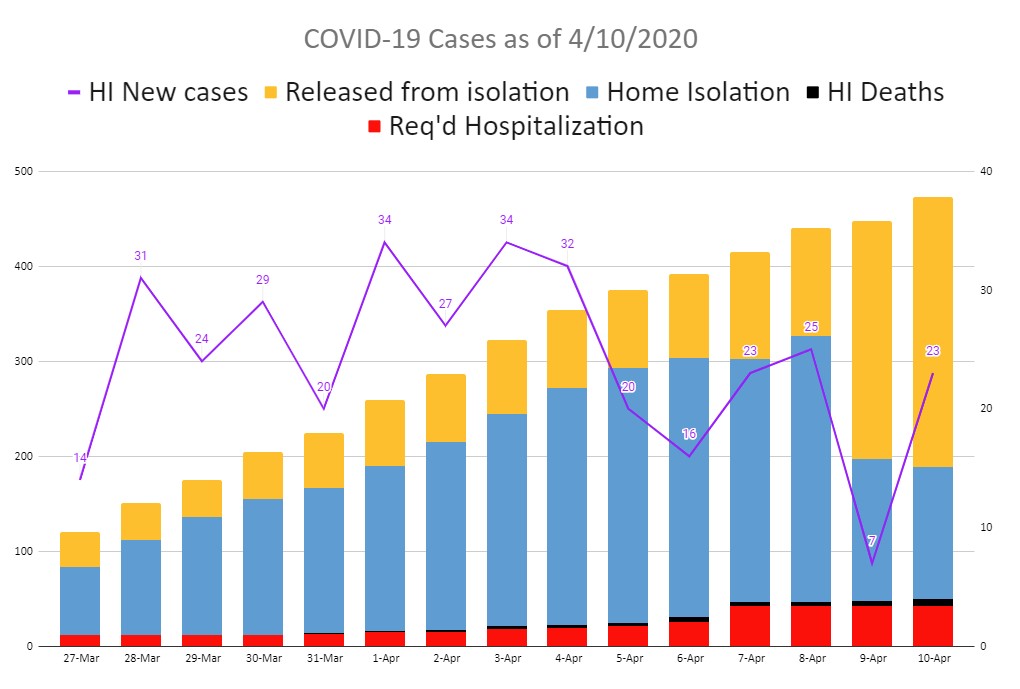
Combo chart showing makeup of all COVID-19 cases and line graph of new cases 
Bar chart of current and forecast covid19 growth comparing Hawaii with benchmark global sources

What do you think?