
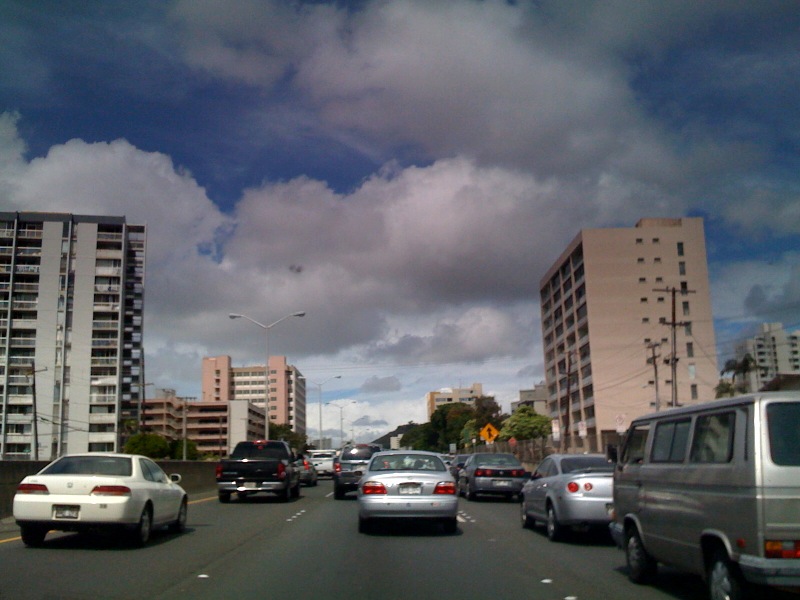
Many people ask that question, “Is Hawaii overpopulated?” often and this has been a concern for decades. Hawaii is a beautiful and amazing place. Due to its natural attractive qualities, overpopulation has occurred as a result. Just like New York City, overpopulation can prompt some very uncomfortable living situations for its residents, like traffic. Everyone in Hawaii knows about the traffic, and how much of a pain it can be on the daily commute.
Hawaii’s overpopulation example #1: True Population Density of each Hawaiian Island
Population density is usually computed by taking the population and dividing by the total land mass in square miles. However in Hawaii, that could be a misleading number because very little of Hawaii’s total land mass is zoned for housing. The table below shows the “true” population density based on actual urban zoning area (“Pop/Urban Sq Mi”) and notice how that compares with the total island size density (“Pop/Island Sq Mi”) .
This table is reveals some pretty dramatic differences between the islands, such as:
- How sparsely populated the Big Island is (50 people per sq mi) vs Oahu (1685 people per sq mi)
- Oahu has nearly 2x the urban zoned area than the Big Island yet has 5x the population.
- Maui and Kauai have nearly the same urban density yet Kauai has almost half the total island density
- Oahu’s density is really clear!
Population Densities for Hawaii Counties 2023
(Pop/ = “Population Per”)
| Island | Total Sq Mi | Urban Sq Mi | Population | Pop/Urban Sq Mi | Pop/Island Sq Mi |
|---|---|---|---|---|---|
| Hawaii | 4,021 | 85 | 200,629 | 2371 | 50 |
| Maui | 728 | 38 | 154,100 | 4096 | 212 |
| Oahu | 603 | 159 | 1,016,508 | 6396 | 1685 |
| Kauai | 553 | 23 | 73,214 | 3159 | 132 |
Hawaii overpopulated example #2: Poverty Rate in 2023
Poverty rate is another economic indicator of how dense an area is. Although it’s not as accurate as population density statistics, it can show you how many people are “living on the street.” Homelessness is attributed to several factors, one of which is housing availability. According to data from the U.S. Census Bureau, the state’s poverty rate in 2022 was 11.2%, compared to the national poverty rate of 11.6%. But again, if you’re thinking of moving to Hawaii, it would be a good idea to compare the poverty rate in your town on the same U.S. Census Bureau site .
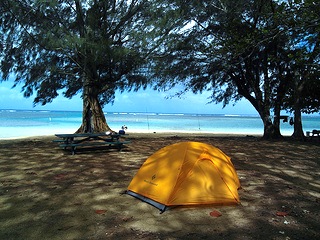
Anini beach park by Sebastian Werner is licensed under CC BY 2.0. Image may have been resized or cropped from original
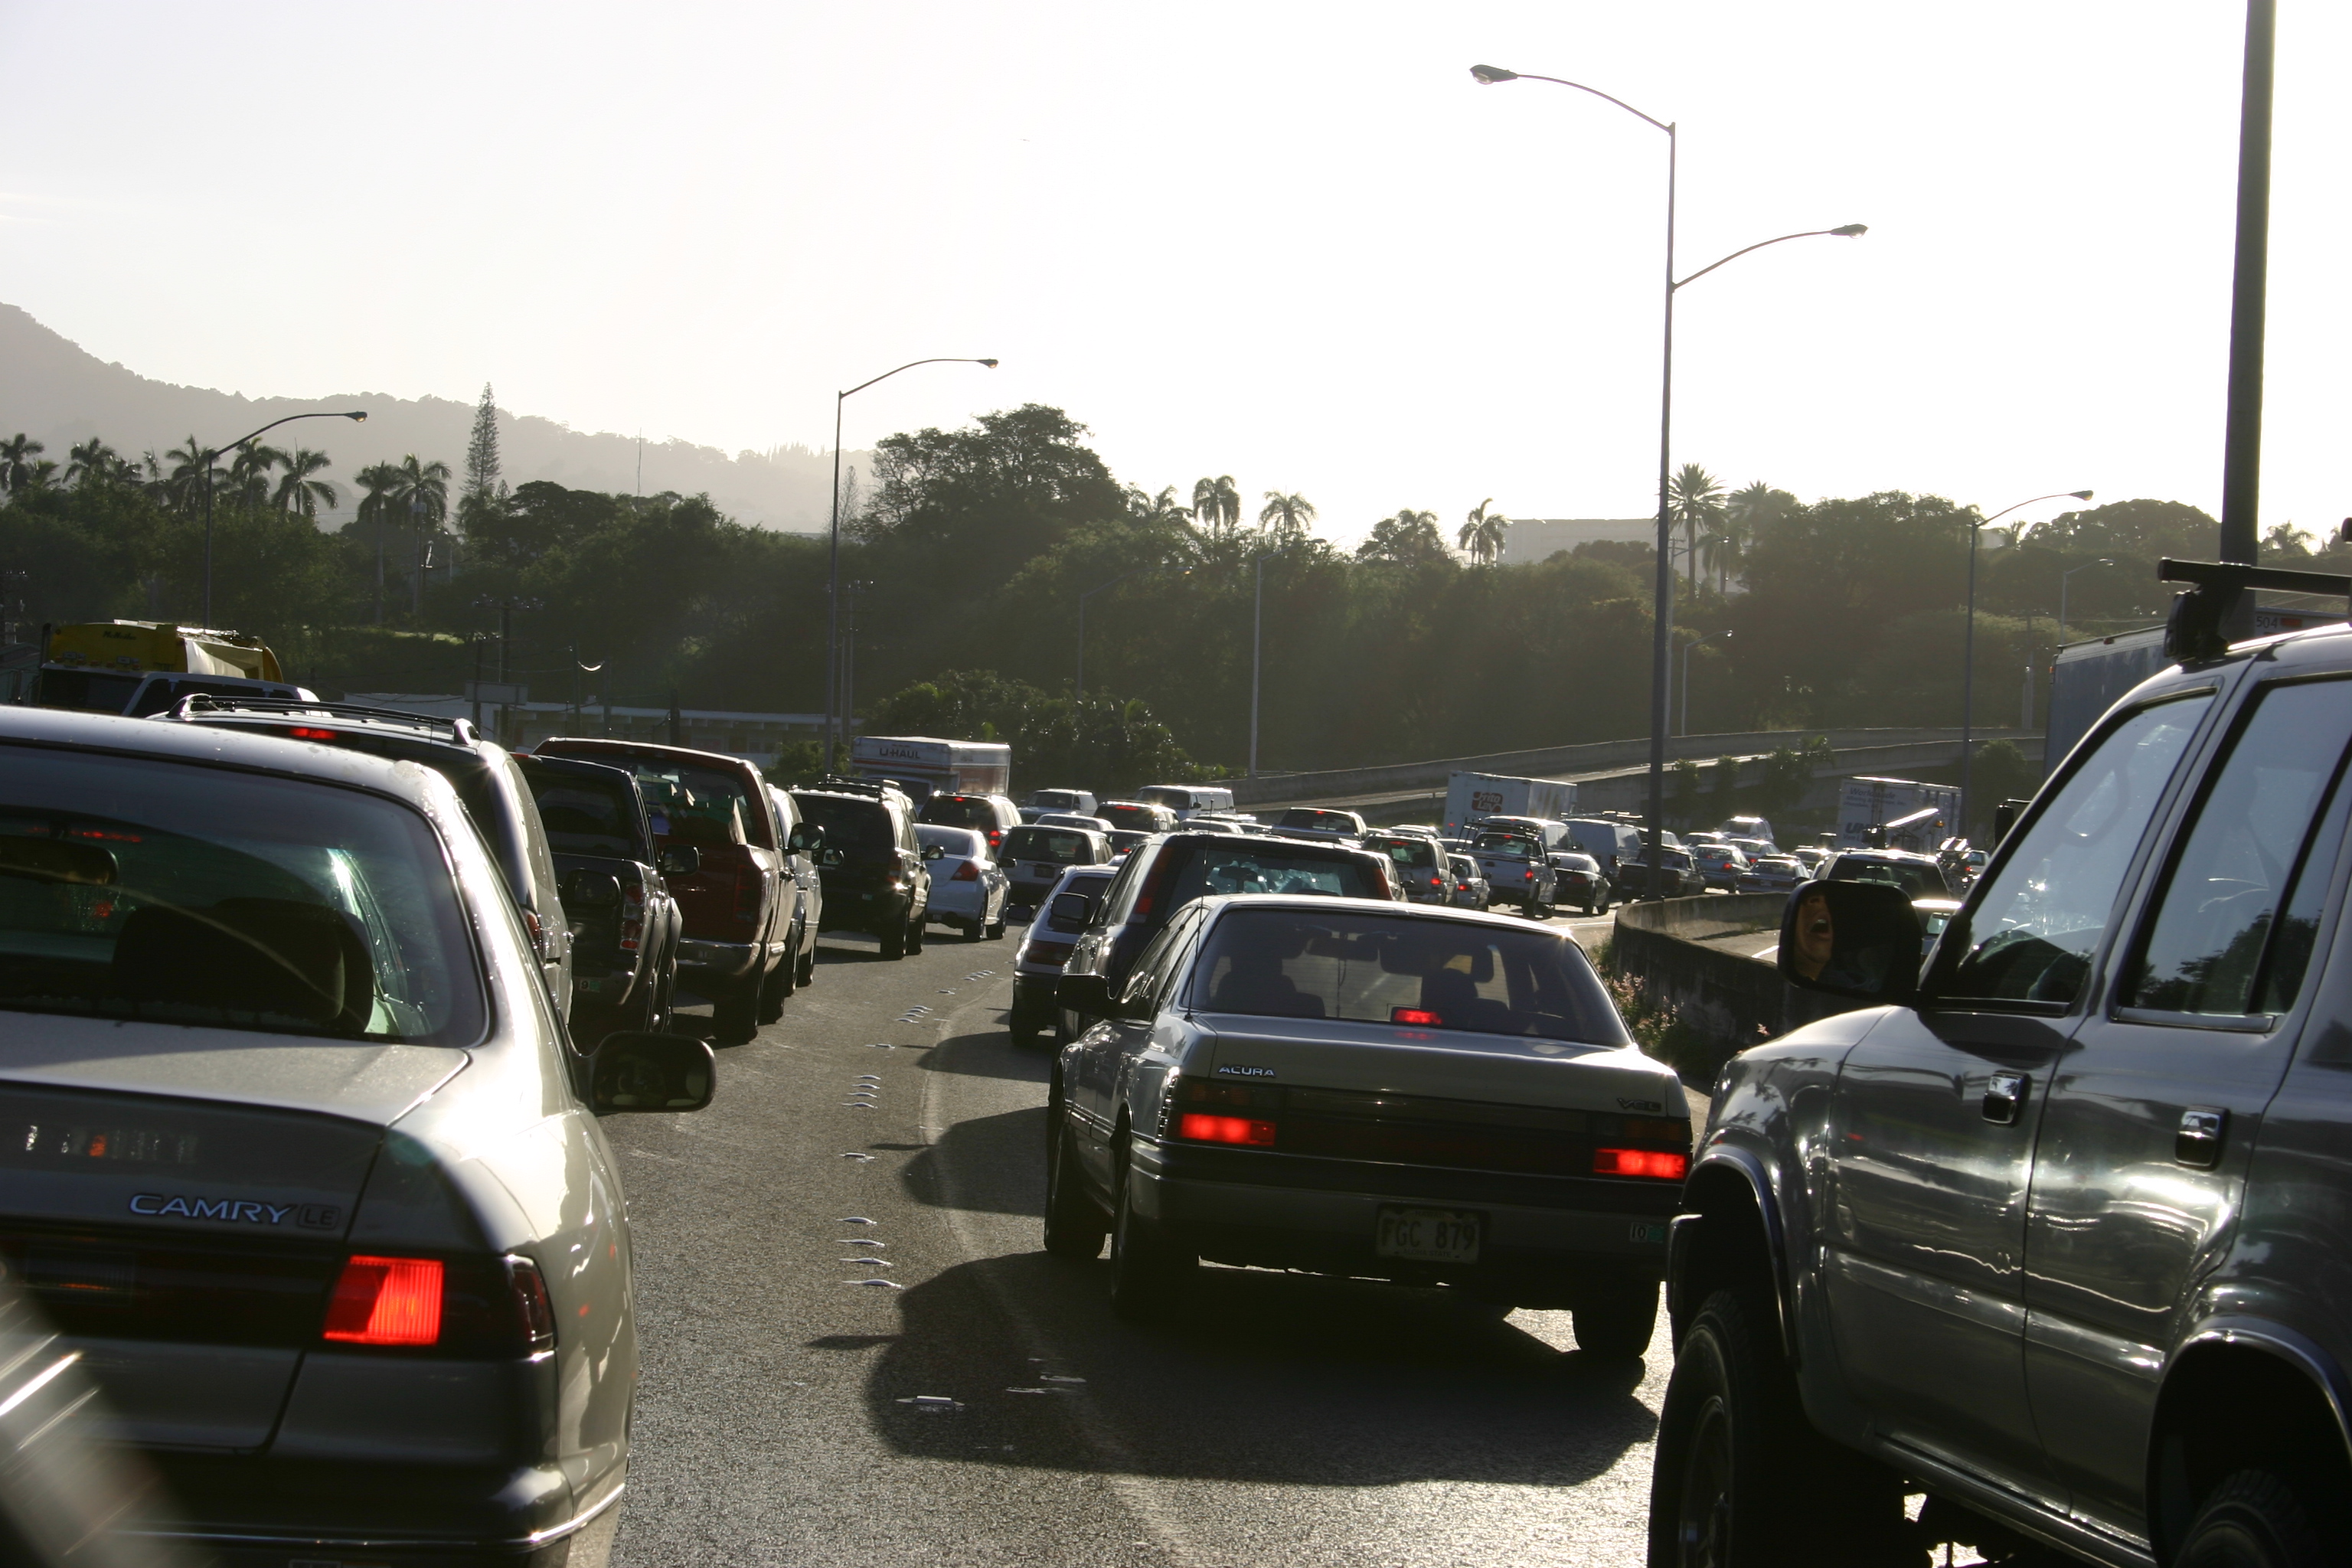
Hawaii overpopulated example #3: Commute Time in 2023
Mean travel time to work in the islands is 26.7 minutes (data from 2022 for workers age 16+) compared to the national mean of 26.8 minutes. So, this can give you an idea of how much traffic will be on the roads during rush hour for everyone’s daily commute. However, keep in mind that this is the mean. Your actual commute time could be far more or far less than this. Like I said, compare these statistics to the same data from your own town so you can get a better idea of what your Hawaii commute would be like.
IMG 0019 by Sun Brockie is licensed under CC BY-NC-ND 2.0. Image may have been resized or cropped from original.
Hawaii overpopulated example #4: Population Growth 2010-2020
Population growth is another economic indicator of how much the population is growing over a fixed time period, which is a contributing factor to the “packedness” of an area. A rough estimate of the population change in Hawaii from 2010 to 2020 is 7% compared to the national average of 7.4%. Although this is not a high number, it would be a good idea for you to compare this to statistics in your hometown. Everything is relative. For example, a 4.4% change in population for a rural town in Nevada with a population of 100 people would result in a new population of almost 105 people. Everything is relative.

H1 freeway traffic light trails by 71356546@N04 is licensed under CC BY 2.0. Image may have been resized or cropped from original.
