
These charts are now almost the same day after day.
I’m going to change the cadence from 1x/day to every Tuesday & Friday because there’s really not much changing. In fact, you can assume this description will fit until you get the next report from me on Tuesday 4/28.
Our case growth rate remains below 1% for an essentially flat curve. The rest of the world continues to improve with curves slowly flattening. We’ve now been on a 14 day downward trend for well over a week.
All suggestions and commentary is welcome!
| Total Cases: | 596 |
| Current Growth Rate: | 0.7% |
| 3 Day Average Growth Rate: | 0.7% |
| Current Home Isolation: | 78 |
| Current Hospitalization: | 63 |
-

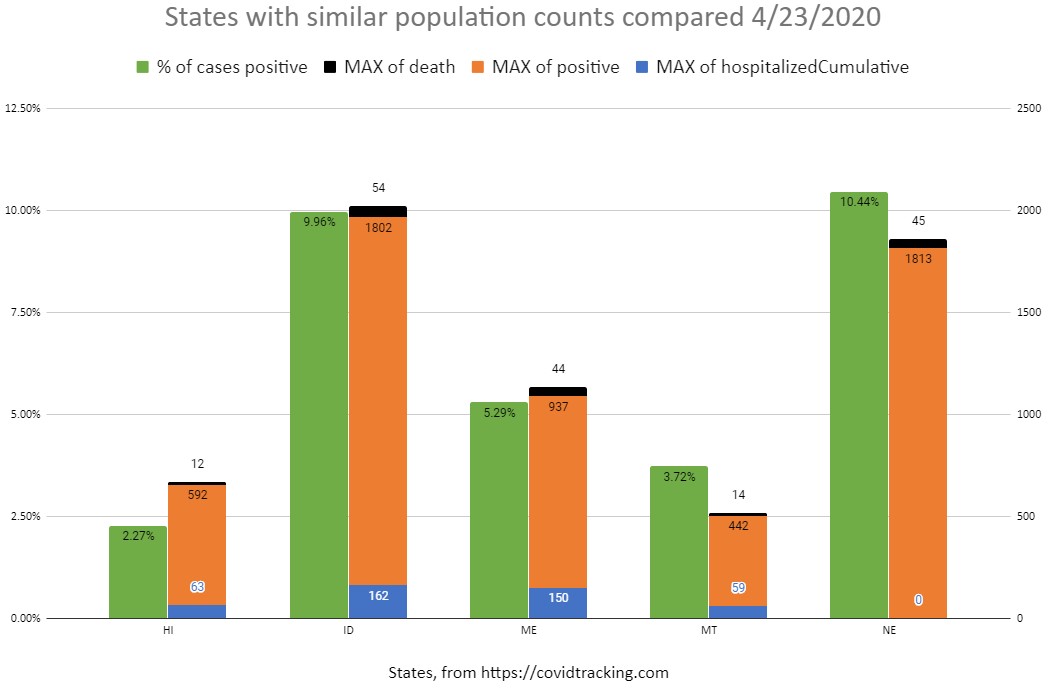
Bar chart showing how Hawaii compares to other states of similar population -

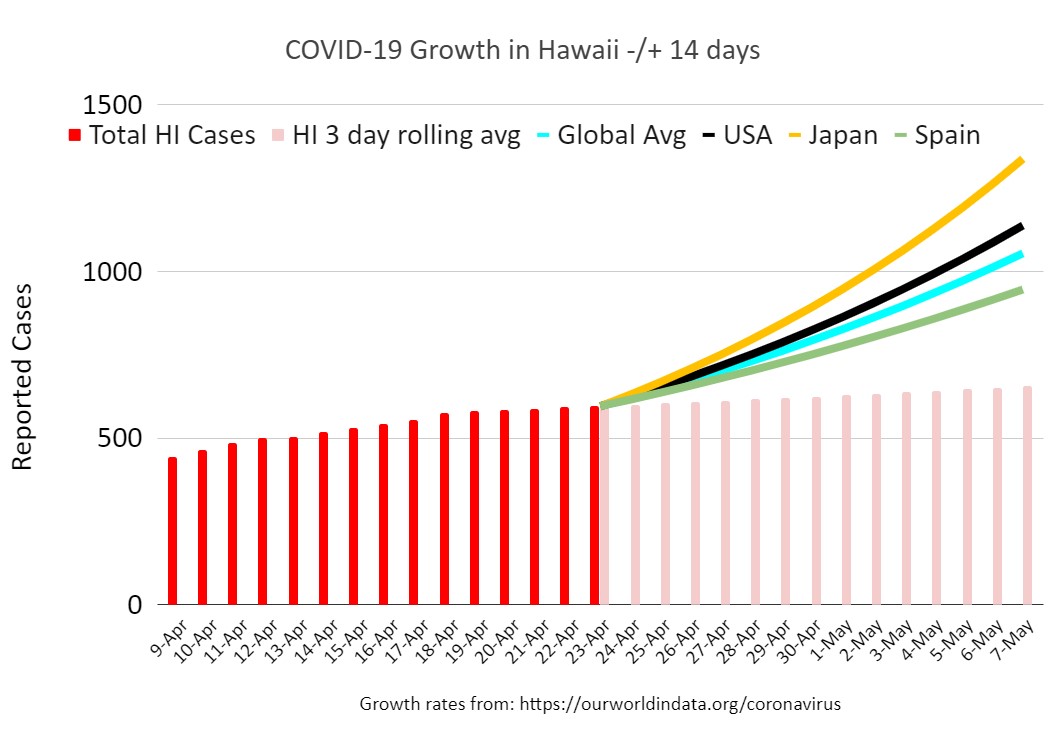
Bar chart of current and forecast covid19 growth comparing Hawaii with benchmark global sources -

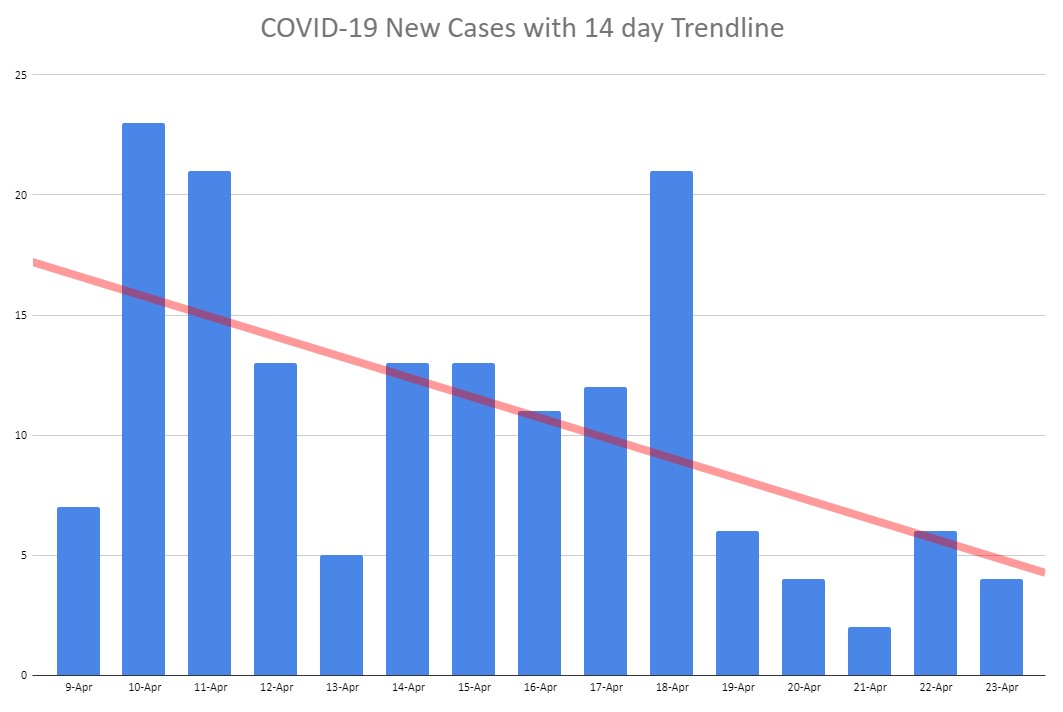
Bar chart of new cases each day with trendline -

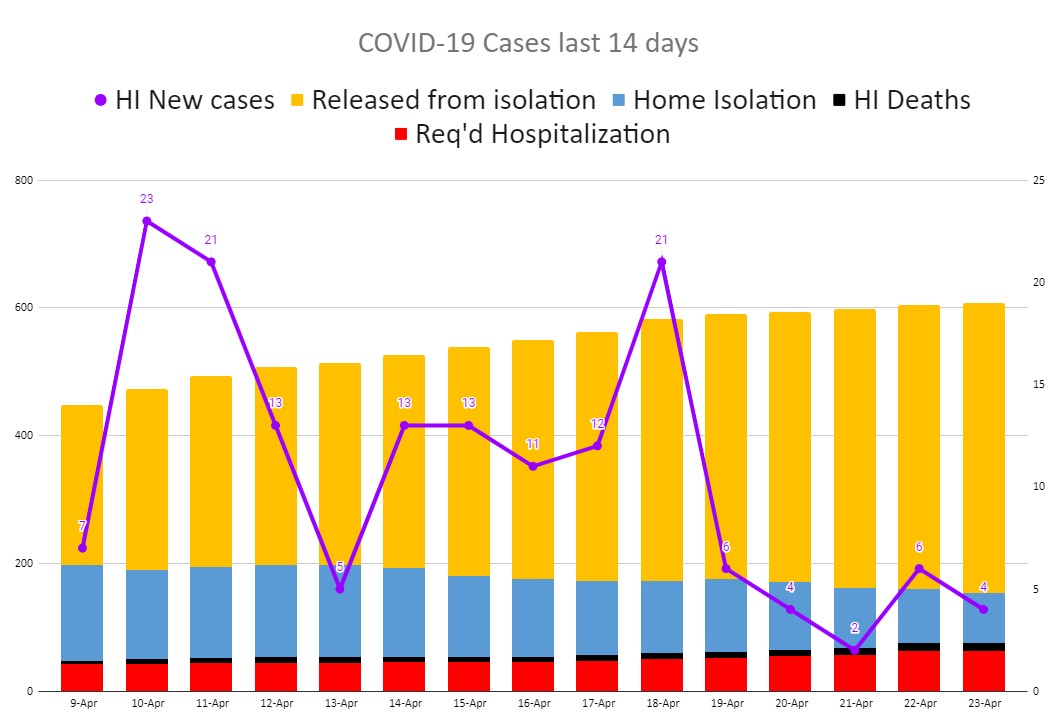
Combo chart showing makeup of all COVID-19 cases and line graph of new cases

What do you think?