
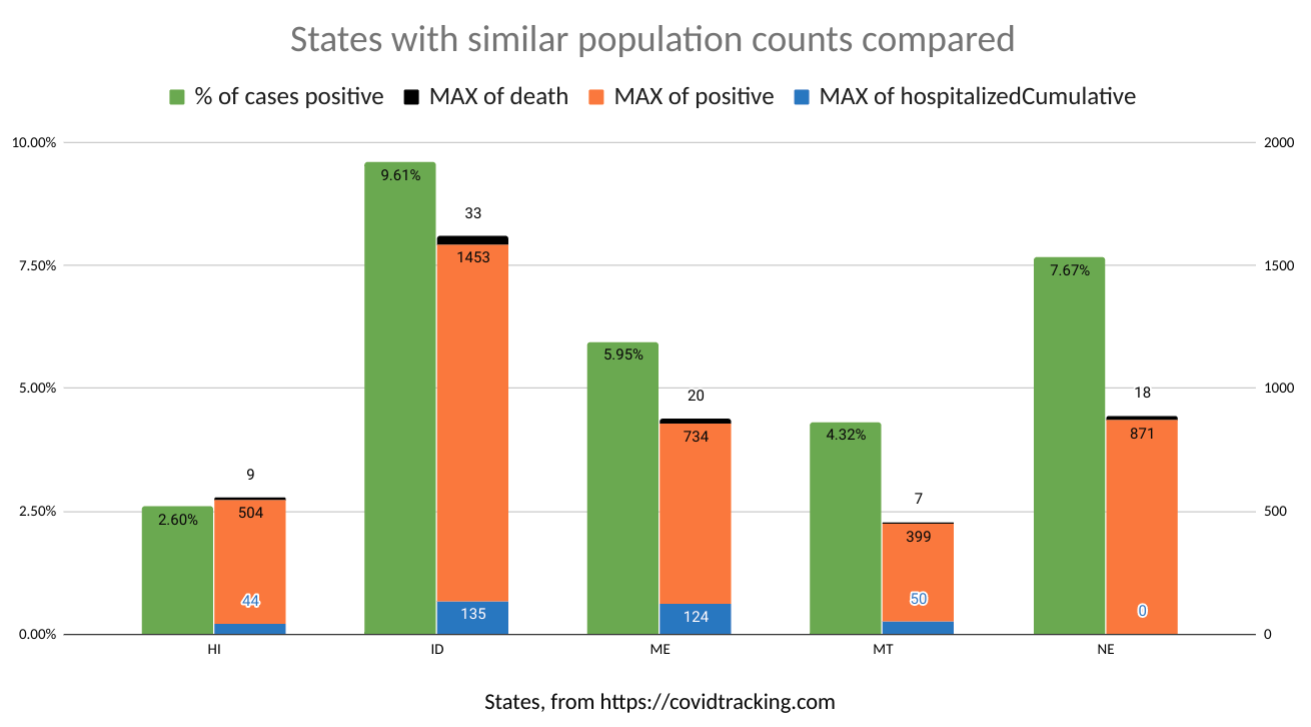
New graph today showing how Hawaii compares to states with similar populations.
I finally found data showing total tests made and now can display our % positive of total tests. It’s hard to pick good comparison states but based on the sample, Hawaii is doing very well on all numbers.
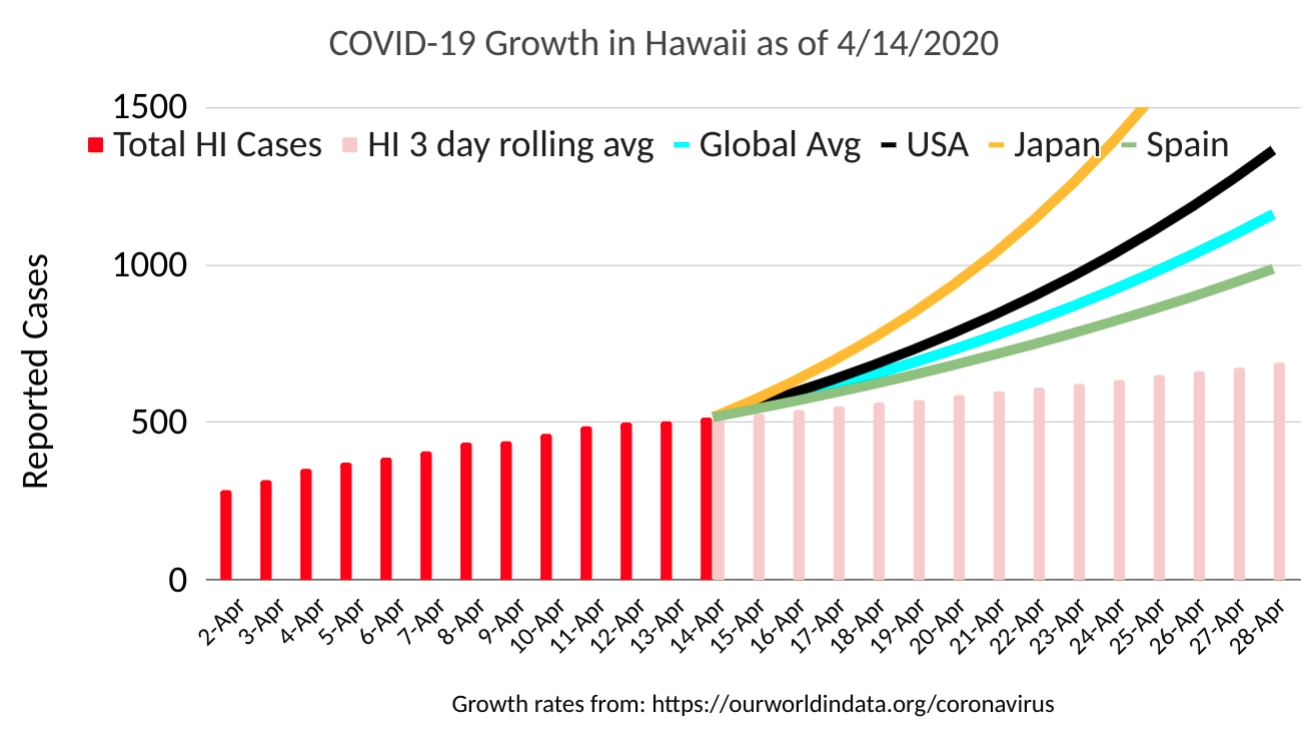
Japan continues to accelerate in the wrong direction which should give us pause in how we plan to return to normal, risking the possibility of renewed outbreak.
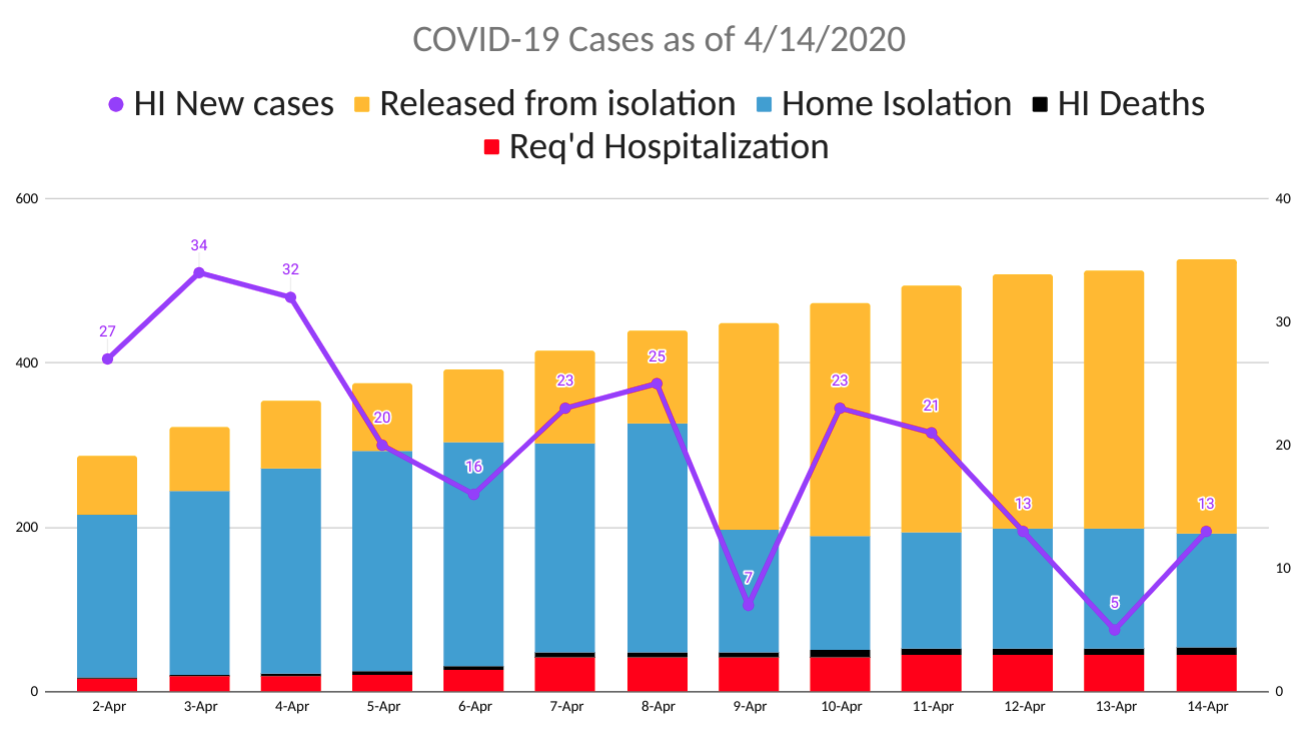
| Total Cases: | 517 |
| Current Growth Rate: | 2.6% |
| 3 Day Average Growth Rate: | 2.1% |
| Current Home Isolation: | 139 |
| Current Hospitalization: | 45 |

Bar chart showing how Hawaii compares to other states of similar population 
Combo chart showing makeup of all COVID-19 cases and line graph of new cases 
Bar chart of current and forecast covid19 growth comparing Hawaii with benchmark global sources

What do you think?